Free TikTok Engagement Rate Calculator

    Our free TikTok engagement rate calculator measures how influencers connect with their audiences. With just a TikTok account username, you can track engagement metrics, likes, and comments and assess follower authenticity.

    Engagement Rate
    9.3%
    Followers
    93.7M
    Media Count
    787
    Average Views
    30.5M
    Engagement Distribution
    No data available at the moment
    no data
    Most used #hashtags
    #1upsourchallenge#2021
    #hashtag#hashtag#hashtag#hashtag#hashtag#hashtag
    Audience gender
    Male300(54%)
    Female260(46%)

    Analyze TikTok Influencers: Real-Time Examples & Case Studies

    Click profiles below to explore live influencer analytics or enter any username above.

    How to Calculate Influencer Engagement Rate

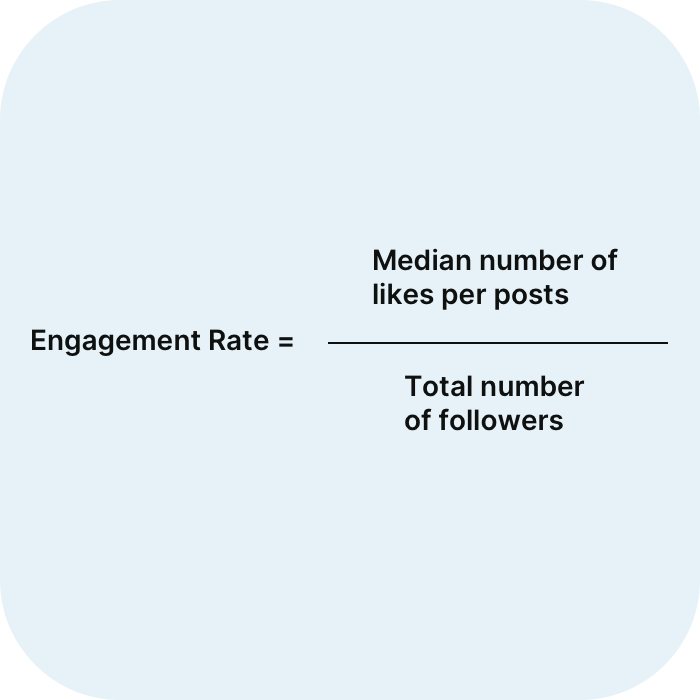
    To determine an influencer's engagement rate, take the median number of engagements (likes + comments, etc.) across all the influencer's posts on a particular profile, divide by the total number of followers, then multiply by 100. Using this formula, you can view the total overall engagements for an influencer's profile.

    Check Engagement Rates
    Check Engagement Rates

    What is a Good Engagement Rate on TikTok?

    Analyzing engagement rates only works when you have benchmarks against which to compare them. Leveraging our database of over 150 million social media influencers and the latest AI technology, we've compiled key benchmarks for you.

    High
    >5.29%
    Above Average
    3.43%
    Average
    2.6%
    Below Average
    1.37%
    Low
    1.04%

    Key Factors Impacting Engagement Rate

    Understanding what drives engagement helps marketers identify high-performing influencers and optimize influencer marketing campaigns:

    Audience Interaction

    Prioritize creators with balanced likes, comments, and shares. Genuine engagement includes thoughtful discussions and shares, not just passive likes.

    Content Quality & Format

    Video content typically sees higher engagement than static posts. Educational or entertaining content also resonates more deeply.

    Audience Relevance

    Engagement thrives when the influencer's audience aligns with the brand's target demographics and interests. Mismatched audiences lead to disengagement.

    Consistency & Timing

    Regular posting keeps audiences engaged, but oversaturation can cause fatigue. Timing posts to when followers are most active maximizes visibility.

    Authenticity

    Followers engage more with creators who share genuine stories and transparent recommendations. Overly promotional content often underperforms.

    Platform Trends

    Adapting to algorithm preferences and changes on social media platforms boosts reach and engagement.

    Pro Tip: Simplify Influencer Marketing with Gleemo

    While a high engagement rate doesn't guarantee ROI, it's a strong indicator of campaign potential – if the engagement is real. Fake engagement artificially inflates costs and erodes trust. For campaigns targeting ROI over reach, prioritize influencers with:

    • Audience engagement rates 2x higher than their niche average
    • Audience demographics that align with your target market and criteria
    • Proven conversion history (e.g., swipe-up links or shoppable posts)
    By combining Gleemo's influencer analytics with performance tracking, brands can turn engagement into measurable revenue and build campaigns that deliver actual returns!

    Frequently Asked Questions

    TikTok influencer engagement rate measures how actively a creator’s audience interacts with their content through likes, comments, shares, and saves. It reflects the percentage of viewers who engage relative to total views or followers, indicating content resonance and audience loyalty. A higher rate suggests the creator’s content successfully captivates their audience, making them valuable for brand partnerships.

    Unlike vanity metrics like follower count, engagement rate highlights genuine audience connection, which is critical for brands prioritizing authentic reach and campaign effectiveness on TikTok’s dynamic, algorithm-driven platform.

    TikTok engagement rate is calculated using: Engagement Rate (%) = (Median engagements per video / Median views per video) × 100. Engagements include likes, comments, shares, and saves.

    This formula focuses on ​views​ instead of followers (unlike Instagram), as TikTok’s algorithm can push content to broader audiences, making views a more relevant denominator. Using median values (rather than averages) minimizes distortion from viral outliers, ensuring a realistic baseline. For example, a video with 10,000 views and 400 engagements has a 4% rate, signaling strong viewer interaction.

    General benchmarks categorize TikTok engagement rates as:

    ​0.66%–2.3%: Standard ​2.3%–3.96%: Good ​3.96%+: Exceptional

    However, “good” varies by niche and account size. Nano-influencers (1k–10k followers) often exceed 4% due to tighter audience connections, while larger accounts may average 1.5–2.5%. Always compare rates against similar creators (e.g., same niche, follower range) for fair evaluation. For instance, a beauty creator with 50k followers and 3% engagement could outperform a fashion peer at 2% if their audience aligns better with your target demographic.

    Yes, several tools and platforms, such as Gleemo, can help you track engagement rates by providing analytics and insights into your social media performance. Sign up to our platform now!